Projected population
490,508
People in the source urban footprint, 2025 projection.
United States · Urban evidence profile
Begin with the place behind the name. Inspect the published urban footprint, its projected population and the questions to investigate before a visit or a move.
Projected population
490,508
People in the source urban footprint, 2025 projection.
Footprint area · km²
245
Published morphological urban-centre area.
Derived density · people/km²
2,002
Projected population divided by source footprint area.
Publisher 2025 population projection from GHS-POP R2023A and morphological urban-footprint area; density is their ratio. Not a current census count, municipal population or livability score. Shared footprints repeat one contextual measurement, not independent city estimates.
Historical rental housing context
2025 ACS one-year estimates · table B25070. Destination guide: Pittsburgh.
30%+ gross-rent share
52.4%
Of housing units with a computed gross-rent-to-income ratio. Published rounded percentage bins.
Context only · outside the index
City place · exact Census place
This estimate covers renter housing units in Pittsburgh city, Pennsylvania. It uses the native Census place for ACS 2025, not the whole metropolitan area or JRC urban footprint. The named place and state are matched exactly to the original 2025 geography metadata; no boundary equivalence or scoring permission is inferred.
1600000US4261000
The source universe is renter-occupied housing units. The derived denominator includes only units in published computed gross-rent-to-household-income categories; these are housing units, not persons or all residents. ACS household money income includes wage and salary amounts before tax deductions, and net self-employment income. It is not disposable or after-tax income.
ACS 2025 one-year survey estimates use interviews throughout 2025 and the source past-12-month household-income concept. These are historical survey estimates, not a year-end census or 2026 asking prices. The separate pooled 2020–2024 five-year series is not used to calculate an annual change. This is not a current asking-rent quote, a count of people, or an overall livability score.
| Published cell | Housing units | 90% MOE (units) |
|---|---|---|
| Total:B25070_E001 / B25070_M001 | 84,543 | ±5,184 |
| Less than 10.0 percentB25070_E002 / B25070_M002 | 2,916 | ±1,011 |
| 10.0 to 14.9 percentB25070_E003 / B25070_M003 | 6,424 | ±1,639 |
| 15.0 to 19.9 percentB25070_E004 / B25070_M004 | 8,913 | ±1,959 |
| 20.0 to 24.9 percentB25070_E005 / B25070_M005 | 10,807 | ±2,289 |
| 25.0 to 29.9 percentB25070_E006 / B25070_M006 | 9,019 | ±1,919 |
| 30.0 to 34.9 percentB25070_E007 / B25070_M007 | 5,273 | ±1,853 |
| 35.0 to 39.9 percentB25070_E008 / B25070_M008 | 3,031 | ±968 |
| 40.0 to 49.9 percentB25070_E009 / B25070_M009 | 8,094 | ±2,121 |
| 50.0 percent or moreB25070_E010 / B25070_M010 | 25,450 | ±3,364 |
| Not computedB25070_E011 / B25070_M011 | 4,616 | ±1,482 |
Calculation: 100 * sum(B25070_E007..B25070_E010) / sum(B25070_E002..B25070_E010)
The excluded Not computed category includes units paying no rent and households reporting no income or a net loss. Excluded counts and shares remain visible; these units are not classified as unburdened.
All original published 90% cell margins of error remain attached. Derived aggregate count and percentage margins of error, confidence intervals and covariance are unknown. No independent-error or joint-coverage assumptions are introduced; full calculation decimals do not imply measurement accuracy.
Source retrieved: 2026-10-30T00:51:18.586970+00:00. Evidence reviewed: 2026-10-30. These dates do not change the 2025 observation period.
table source frame ↗SHA-256 f7259df745990893dfa6f18af3b4cb60c65f8410e66bf25678a98bc7b0739587
geography source frame ↗SHA-256 c8e9250ae8d2632bff4c9e800e5880722ea2cbd899a81c3ef071165fea13e387
variables source frame ↗SHA-256 64efe36c916321a7a1fb97b246fe5189f317cb7f3e250d6bc40e12c26bee44b0
Copy with the denominator intact
Includes source period, native place, exclusions and uncertainty.
U.S. Census Bureau, American Community Survey, 2025 American Community Survey one-year estimates, table B25070, Pittsburgh city, Pennsylvania (1600000US4261000). BestCityToLive derived 52.4% from 41,848 housing units in the published 30%+ gross-rent-to-income bins / 79,927 units with a computed ratio; 4,616 not-computed units excluded (5.5% of 84,543 source-universe units). Original cell margins of error are at 90% confidence; an aggregate margin of error or confidence interval is not computed. Historical 2025 context, not current asking rent or a Civometra Index input. Source: https://www2.census.gov/programs-surveys/acs/summary_file/2025/table-based-SF/data/1YRData/acsdt1y2025-b25070.dat Retrieved 2026-10-30T00:51:18.586970+00:00; reviewed 2026-10-30.
Read the geography
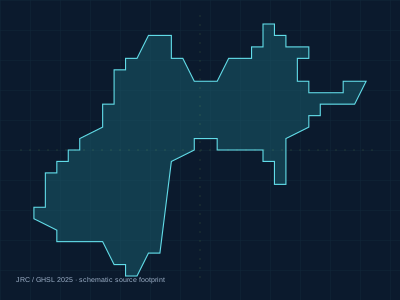
The source calls this footprint Pittsburgh, urban-centre ID 7847. A morphological urban centre follows connected settlement; it does not establish municipal limits, current commuting patterns or a particular neighborhood’s conditions.
The atlas outline is a simplified design from the source geometry. The source reference point is not a surveyed address or a reviewed city-centre pin. A city’s municipal population, metro population and this projection may differ without any of them being the same measure.
Explore United States destinationsA record you can cite
European Commission, Joint Research Centre · GHS Urban Centre Database 2025 · GHS-UCDB R2024A V1-2. Population is a short-range projection based on GHS-POP R2023A. Our density is an explicit arithmetic derivation. None of these quantities is an overall livability score.
The next layer of research
This is an evidence profile, with local guide research still pending. We have not assigned a new overall rank or filled unknown conditions from national averages. Use these questions to structure your own checks.
01 / Research question
Check current local sources, the actual neighborhood and household or visitor needs. Review geographic scope, eligibility, observation period and service access before comparing figures.
New-edition evidence not yet assessed here.
02 / Research question
Check current local sources, the actual neighborhood and household or visitor needs. Review geographic scope, eligibility, observation period and service access before comparing figures.
New-edition evidence not yet assessed here.
03 / Research question
Check current local sources, the actual neighborhood and household or visitor needs. Review geographic scope, eligibility, observation period and service access before comparing figures.
New-edition evidence not yet assessed here.
04 / Research question
Check current local sources, the actual neighborhood and household or visitor needs. Review geographic scope, eligibility, observation period and service access before comparing figures.
New-edition evidence not yet assessed here.
05 / Research question
Check current local sources, the actual neighborhood and household or visitor needs. Review geographic scope, eligibility, observation period and service access before comparing figures.
New-edition evidence not yet assessed here.
06 / Research question
Check current local sources, the actual neighborhood and household or visitor needs. Review geographic scope, eligibility, observation period and service access before comparing figures.
New-edition evidence not yet assessed here.
Other atlas destinations in United States, ordered by similarity of projected source-footprint population. This is a scale comparison, not a quality ranking or a distance measure.